
GC and its effect on Java Performance
Garbage Collection in Java is one of the least known topics among developers, so in this article, we will discuss the basics of GC.
Introduction to Garbage Collection.
In Java, you don’t explicitly control the lifecycle of an object, objects are created in memory automatically when needed and JVM will also free space occupied by an object when that object is no longer needed. Garbage collection is the process by which JVM automatically free space. According to most people definition of Garbage Collector will be “it is responsible for finding unreachable objects and then deleting those unreachable objects to free space in heap”. In reality, it is just the opposite of this! Garbage collector finds objects which are in use and delete everything else other than these objects. Saying Garbage Collector finds objects which no longer have reference to them would imply that there is some count which keeps track of total references and once that count becomes 0 objects is deleted from memory which is not true. It is also not a good idea to do Garbage Collection based on some reference count as say in the case of a circular linked list, every node will be referenced from some other place even after we cannot access it from our code. So the fundamentally correct definition of Garbage Collector would be:
“It consists of finding objects which are in use and freeing the memory associated with any remaining objects”
Since Garbage Collector plays a very important role in the performance of your application there are multiple garbage collectors available. In OpenJDK we have a total of 7 different types of Garbage Collectors, out of these only 3 which is recommended for production, 1 has been deprecated from java 11 other 3 are experimental. We will learn more about 3 production-ready garbage collectors in the latter part of this article.
How GC works internally
When I said earlier that Garbage collector find objects which are in use, then you might have thought how will garbage collector know which objects are in use? Well, it starts from GC roots and objects which can be accessed from GC roots then that object is in use. You are maybe thinking know what are GC roots? GC roots are objects which are accessible from outside heap memory which includes but not limited to, thread stacks and system stack. Let's understand this better with an example:

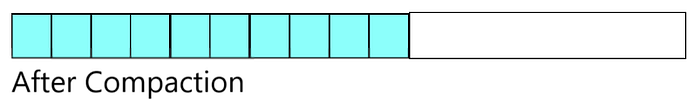
In the above program, in the main function we have 2 GC roots, one is departmentFinance variable and another is departmentHR since both variables are defined in stack area, now after line 35 whenever GC will run it will found object department with the name Finance and object employee with name Bob is in use because both are accessible from departmentFinance and GC will remove all other remaining objects. Freeing memory is not the only responsibility Garbage collector has, it have one more responsibility i.e. compaction. Whenever we are just keeping track of free memory and using it for future allocation can be very inefficient, especially when objects are of different size. To better understand this, let's think about a program that is creating two arrays of size 1000 bytes and 500 bytes in a loop which is running 10 times, and before running this loop we had heap memory of 15000 bytes free. Now after this loop we have 0 bytes free in our memory. In the next line, we delete all arrays which we created earlier with the size of 500 bytes. Now memory will look something like in figure 1.

Now if you have to allocate 1000 bytes more in heap memory for the array, there is no continuous 1000 bytes available even when our heap memory has 5000 bytes free, this wasted memory is known as memory fragmentation. Memory fragmentation is solved by Garbage Collector by moving all allocated memory at one place. The process of moving allocated memory at one place is known as compaction. Figure 2 represents how heap memory will look after performing compaction. It is clear now after compaction we can allocate 1000 bytes easily in heap.
Garbage collectors perform mainly these 3 operations: 1) finding unused heap memory. 2) freeing heap memory 3) compacting the heap. Different Garbage collector perform these 3 operations differently, some perform compaction at regular intervals, others delay compaction until absolutely necessary, other perform compaction in entire heap memory at once that is why different garbage collector performs differently. Please note here that whenever compaction is performed all application thread must be stopped as when objects are moved there location in memory is changed and the new location is to be updated in all references. Whenever all application threads are stopped by GC this is known as stop-the-world pause and these pauses have a lot of impact on the performance of the application.
Generational Garbage Collectors
In Java, many objects are short-lived, let's take the example of the below code
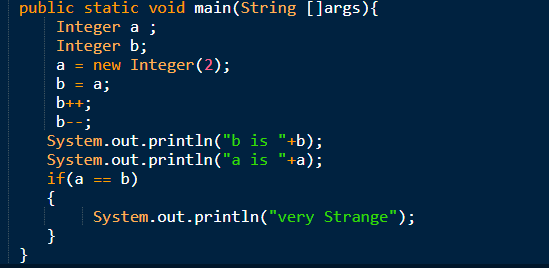
the Output of the above will be :

this is because Integer like many other classes in java is immutable whenever we are doing any arithmetic operation on it, it is creating new object. To take advantage of this most of Garbage collectors divide the heap into 2 different generations i.e. old generation and the young generation. The young generation is further divided into Eden and survivor spaces.
Objects are first created in the Young generation and when the young generation is full then objects which are not in use are discarded other objects are moved in the old generation. Since all objects are moved or deleted from young generation space, so there will be no need to compact young generation, Genius! right? Yes, it is indeed. For deleting objects from the young generation all application threads need to be stopped and this process is known as minor GC or young GC.
“Hey, you said the Young generation is divided into 2 parts, Eden and Survivor? where they come in the picture?”
Well Objects are created first in Eden then when Eden is full then objects are moved to Survivor, there are 2 Survivor spaces let's name them S0 and S1. Let's understand more about survivor through an example, let say an object obj1 which was created in Eden region and it survived till minor GC, then this object will not be moved to old generation but it will be first moved to survivor space lets say s0, except if survivor space is already full then obj1 will directly move to the old generation. let's imagine survivor space was empty so obj1 will move to survivor space s0. If obj1 will be live after the next collection cycle also then obj1 will move from s0 to s1. Now after this collection s0 will be empty.
“Wait a minute! till next cycle, there will be new objects in Eden. So they should move to s0 No? so S0 won't be empty”
Well, that’s a very valid question, but in reality in this cycle objects from Eden will also move to s1 itself. Garbage Collector keeps 1 survivor space always empty. In the next minor GC objects from s1 will move to s0 and so on.
“So if objects are moving s0 to s1 and back to s0, is there any end to this”
Of course, there is a threshold number of minor collections for which an object can stay in survivor space and after that is reached object has to move to the old generation, that threshold is known as tenuring threshold.
You may be wondering why we need survivor space separately. Well as you know heap is divided into the young generation and the old generation because we want to avoid compaction by deleting short-lived objects from Eden itself. Now let's imagine an object with a short life span is created just seconds before minor collection if there was no survivor region even this short-lived will move to the old generation. So to ensure only long-living objects are moved to the old generation we have survivor space.
Now we know in the old generation we only have objects which have already survived the young generation. After some time old generation will also fill up, then the garbage collector will have to find the live objects and delete everything else, and also it will need to do compaction. This process is known as full GC. Different collectors do full GC in different ways, a simpler one will pause all application threads and will do cleanup and this pause is usually very long. There are also some collectors which will try to find unused objects while application threads are still running such collectors are commonly known as Concurrent collector. Pause time in the case of concurrent collectors is low but as a trade-off, such collectors will take more CPU. In the case of REST API, if the nonconcurrent collector is used then for some request during which full GC will run there response time will be much longer on another hand if the concurrent collector is used then CPU will be shared with garbage collector so average response time will be more for REST APIs.
Garbage Collectors
In Java 11 there are only 3 collectors which are recommended for production, in this article we will just concentrate on these 3 collectors, there is also CMS Collector which was widely used in Java 8 but has been deprecated ever since.
The Serial Garbage Collector
It is one of the most simple garbage collectors out there. It is the default java collector on machines that have only a single CPU core. It uses a single thread to clean the heap. Serial Collector can be enabled with option -XX:+UseSerialGC. You may be wondering who uses a single-core CPU these days. Well, you are right this garbage collector may have been deprecated if not for a new technology which has been introduced some year ago and right now is nearly all organization is moving to adopt this, name of technology starts with C and ends at R. Well if you guessed Container then congratulations you are absolutely correct. if you are running a docker image with a single-core processor then it is better to use a serial garbage Collector in most cases. The serial garbage collector can also be used when we have a very small heap(less than 100 MB).
The Throughput Collector
This collector uses multiple threads for minor as well as full GC, hence making collections much faster on machines that have 2 or more CPUs. Back in JDK 8, the Throughput collector was the default collector on a machine having more than 2 CPUs. Since it uses multiple threads Throughput collector is also known as Parallel Collector. Throughput Collector will stop all application threads during minor and full GC and it will also perform compaction during full GC. Throughput collector can be enabled by using the flag -XX:+UseParallelGC. In Java 11 G1 Garbage collector generally is better than throughput collector and G1 Garbage collector should be used whenever possible, but if your application is more CPU bound then a throughput collector will perform better than a G1 garbage collector. Parallel Collector can also be used in noninteractive batch jobs where pauses are no problem.
G1 Garbage Collector
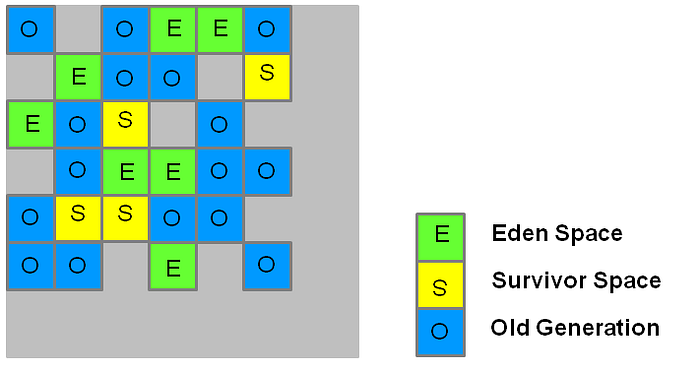
G1 Garbage Collector stands for Garbage First Garbage Collector. It is specially designed to deal with larger heaps and also is the default garbage collector for machines with multiple CPUs. G1 GC is a concurrent garbage collector and is designed to have minimum pause time. G1 GC divided the entire heap into multiple regions and 1 particular region can belong to any of generations. Figure 3 depicts how the heap is divided into regions by G1 Collector.
G1 collector marks the objects from the old generation for deletion concurrently while running application threads however to mark the young generation and clean up application threads is still stopped. G1 collector scans all regions for unused objects and delete only those regions first which have the highest percentage of the unused object, that is why its name is garbage first collector. The G1 garbage collector uses more CPU and should be used only when we can spare some CPU alongside application threads.
We will go to more details about these garbage collectors and also will compare these collectors in a different article. For now, we will continue with some basic tuning operations which are nearly the same for all collectors.
Tuning Heap
Heap Size
If your heap is of very small size then it will become full in no time and full GC have to be run, again and again, hence more time will be spent to clean GC than on application logic. One possible solution is to increase heap size, but one thing which should be remembered is after increasing heap size full GC will run less frequently but will take more time to run, say maybe when heap was of few MBs then it would take few secs to run full GC but when heap will grow into GBs like 30 GB then it will take more than a minute to clean heap. The increasing heap can be an option for long-running batch jobs but you should think twice before increasing heap for interactive services like UI and Rest API. The increasing size of heap more than the size of physical memory should always be avoided as it can lead to thrashing. You should always at least leave 1 GB memory for OS processes, so if your system has RAM of 16 GB at max you should only have a 15 GB heap considering no other process is running. If there are multiple JVM running on the same machine then the sum of their heap should be always less than physical memory size. The size of heap is controlled by two options:
- -Xms which defines the initial size of the heap
- -Xmx which defines the maximum size heap can have
Oracle recommends in the production system initial heap size should be equal to the maximum heap size so that garbage collection can be minimized. By default initial heap size is 1/64 of physical memory and the maximum heap size is 1/4 of physical memory. You can also change these defaults, say you would like to give a maximum heap size of 1/2 rather than 1/4, to achieve this you will need to change option XX:MaxRAMFraction to 2 (default value of MaxRAMFraction is 4).
The above defaults work pretty nice for standard machines where other processes are also running but when it comes to containers these defaults become very inefficient. In Java8, JVM was not able to detect cgroup limits but it could only see all resources which were available on the machine where the container was running which was really a problem as JVM will calculate defaults based on the entire physical memory of the server rather than a memory which is allocated for the container. For this Java8 introduced 1 option which was XX:+UseCGroupMemoryLimitForHeap by this java could read cgroup limits and calculate defaults properly although in Java 10 UseCGroupMemoryLimitForHeap was deprecated since JVM is now cgroup aware and it was not required and also MaxRAMFraction was also deprecated in java 110 and new option, MaxRAMPercentage was introduced which made java better suited to run in a container. The problem with MaxRAMFraction was that it could only be an integer, and in docker where only 1 JVM is running, it is problem, since the maximum heap you can allocate is 50% of memory allocated by assigning 2 in MaxRAMFraction. You may be thinking why 50% you can also assign MaxRAMFraction as 1 by which JVM can use 100% memory assigned to the container but it is very dangerous as the container may also require memory for other internal processes like monitoring etc, so you should never set MaxRAMFraction to 1. MaxRAMPercentage option can perfectly cope with all challenges faced by MaxRAMFraction as you can assign a value from 1 to 100 to it and that much percentage of memory will be allocated to the heap. MinRAMPercentage was also backported to Java 8.
Sizing the Generations
The size of different heap generations also has an impact on performance. Usually, JVM defaults do a decent job in determining the size of various generations but in some rare cases, you need to change those defaults like when there are too many minor GC and you cannot increase heap size then you can try to increase the size of the young generation. By default young generation is 1/3rd of the size of the heap and the old generation is 2/3rd of the heap. When changing the size of the young generation compared to the old generation few tradeoffs should be kept in mind like increasing the size of the young generation will make minor GC less frequent but minor GC will take now more time and also there will be less number of objects which will move to the old generation. If the old generation size will become too small then major GC will run more frequently. When tuning sizes of the different generation below options will help:
-XX:NewRatio: It defines the size of the young generation with respect to the old generation. By default value of the NewRatio value is 2.
XX:NewSize: It defines the initial size of the young generation.
XX:MaxNewSize: MaxNewSize defines what can be the maximum size of the young generation.
-Xmn: You can set newsize and maxnewsize to the same value using this flag
Adaptive Sizing
By default size of heap and size of generation keep changing during execution that is why we define initial heap size and maximum heap size as well as the initial size of the young generation and maximum size of the young generation. With help of adaptive sizing, JVM tries to adjust the size of the heap automatically such that performance criteria can be met. JVM closely monitors the performance of GC and tries to adjust the sizing of the heap by assuming in future GC cycles will be similar to past GC cycles. JVM considers the below goals when configuring heap sizes:
- Desired maximum GC pause goal.
- Desired application throughput goal.
- Minimum footprint
Maximum pause time desired can be communicated to JVM by option XX:MaxGCPauseMillis. JVM will try to keep GC pauses lower than the value specified, by the default value of MaxGCPauseMillis is not set and caution should be exercised when setting maximum pause time as setting it too low will result in GC running multiple time for less amount of time resulting in degradation of performance. XX:GCTimeRatio option is used to tell JVM that a maximum of 1/(1+ value of GCTimeRatio) of application time can be used to run GC. By default value of GCTimeRatio is 99 which implies that the application should get 99 times more time than GC.
JVM will always try to meet desired maximum GC pause goal first if pause times are high then JVM will reduce the size of generation to meet the goal. After the pause time goal is met then JVM will try to achieve the goal of application throughput, if the throughput goal is not being met it will try to increase the sizes of generation. After both goals are met JVM will try to reduce the footprint in the system by reducing the size of the heap.
If you have spent time to find optimal values for the size of the heap you can anytime disable Adaptive Sizing in JVM by option -XX:-UseAdaptiveSizePolicy.
Controlling Parallelism
All GC except serial collector uses multithreading during the collection of the heap. The number of threads that will be used for garbage collection is determined by specification on the platform on which JVM running. According to official documentation from oracle “On a machine with N hardware threads where N is greater than 8, the parallel collector uses a fixed fraction of N as the number of garbage collector threads. The fraction is approximately 5/8 for large values of N. At values of N below 8, the number used is N”. GC threads are quite an efficient one so it can take your CPU usage with less than 8 CPU to 100% quite easily and if you are running multiple JVM then the problem will be increased if multiple JVM will try to run GC at the same time. It is much better to reduce the number of threads in case you are running multiple JVM.
Well this article has become very big so I will like to end it here, of course, we will go into more details about types of GC in future articles and how can we tune it.
